
CI/CD pipeline optimization for Astro: the project and its goals
The work rebuilt a managed WordPress website as a static Astro application on Cloudflare Pages. When these notes were collected, the repository had 174 commits over about 14 days, and the generated site had 53 pages built from a mix of shared layouts and templates.
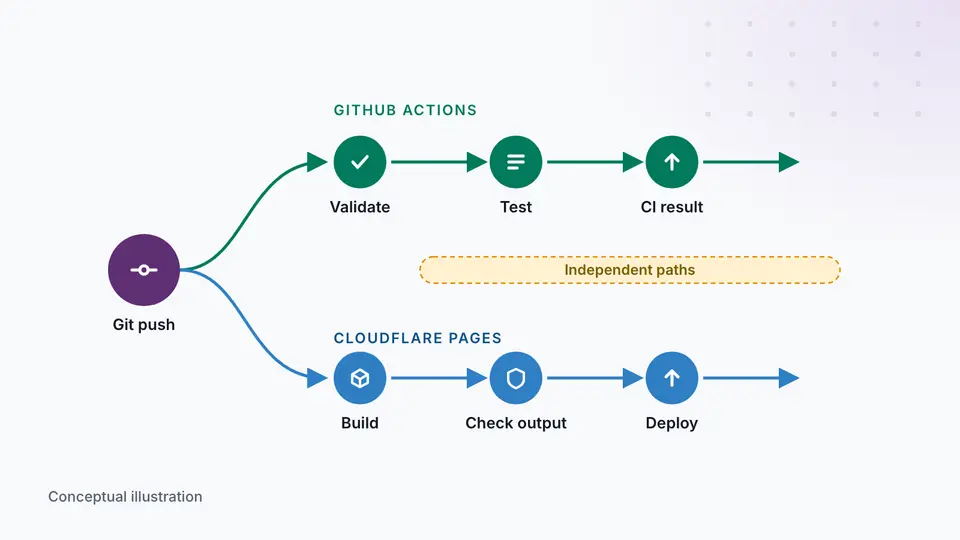
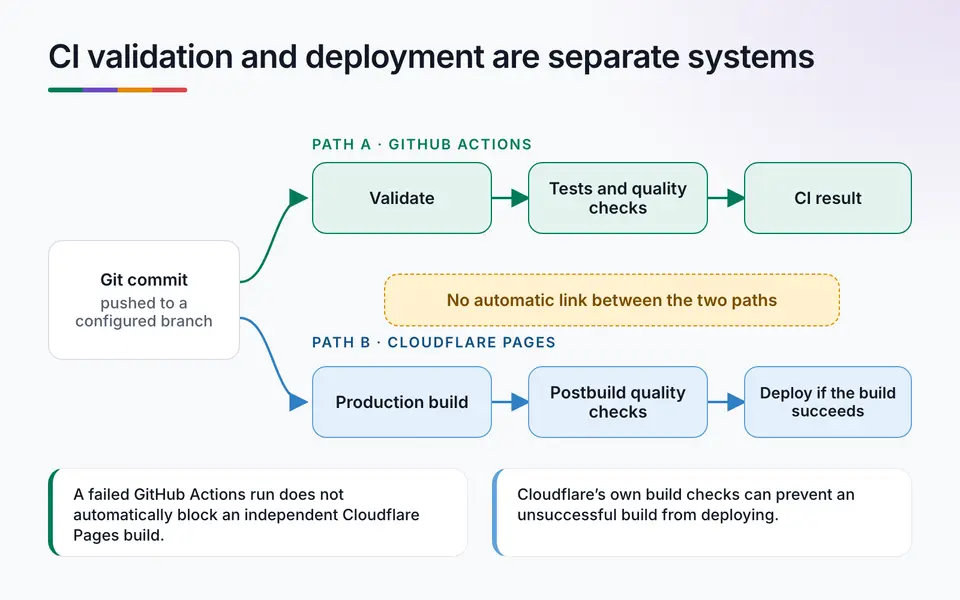
We kept GitHub Actions responsible for validation and let Cloudflare Pages build and deploy through its Git integration. That kept the setup simple but created a boundary between CI and hosting, covered below, that we had to understand properly.
Our goals were these.
- Catch common development errors early.
- Validate the generated website, not only its source code.
- Provide protected preview environments for review.
- Make production releases deliberate and recoverable.
- Avoid unnecessary CI execution and infrastructure complexity.
How validation was organized across six layers
Validation ran in six layers, from a quick local check to live-site tests that only make sense after deployment. Fast validation took about 1.5 to 2 minutes, which is quick enough to give feedback without making anyone wait through a full Lighthouse audit after every change.
| Stage | What ran and what it was for |
|---|---|
| Local pre-commit | Astro checks, linting and formatting, to catch simple errors immediately |
| Local pre-push | Full validation, tests and a production build, to catch more before remote CI |
| GitHub Actions | Validation on pull requests and main pushes, to verify changes in a clean environment |
| Deeper audits | pa11y and Lighthouse on selected events, to check accessibility and performance |
| Cloudflare Pages | The production build and postbuild scripts, to validate the generated output during deployment |
| Live-site checks | Redirects, edge headers and crawler access, which depend on the deployed environment |
A practical GitHub Actions starter workflow
One useful decision was keeping the validation commands in the project instead of repeating them in each workflow. A single npm run validate command runs locally and in CI, which reduces the chance of the two drifting apart, and the workflow file then stays small.
Both listings below are simplified teaching examples, not a copy of the project. Note that the postbuild line assumes those custom scripts exist, and the workflow has no deployment step on purpose, because GitHub Actions validates here and does not publish the site. Before you adapt them, check the action versions, repository permissions, package manager version and project scripts.
Several controls are visible in the workflow.
For a fuller version, see the review kit at the end of this article.
- Read-only permissions: the workflow gets contents read and nothing broader.
- A timeout, so a hung job cannot run indefinitely.
- Dependency caching: the Node setup action caches npm's download cache, not the whole node_modules directory.
- Concurrency control, so outdated runs can be cancelled. The group has to separate event types, as the concurrency problem below shows.
- One shared validation command, so the same checks run locally and remotely.
{
  "scripts": {
    "build": "astro build",
    "postbuild": "node scripts/check-links.mjs && node scripts/check-schema.mjs",
    "validate": "astro check && eslint . && prettier --check . && node --test && npm run build"
  }
}name: CI
on:
pull_request:
push:
branches: [main]
permissions:
contents: read
concurrency:
  group: ${{ github.workflow }}-${{ github.ref }}-${{ github.event_name }}
  cancel-in-progress: true
jobs:
validate:
runs-on: ubuntu-latest
timeout-minutes: 15
steps:
- uses: actions/checkout@v7
- uses: actions/setup-node@v7
with:
node-version-file: .nvmrc
cache: npm
- run: npm ci
- run: npm run validateThe Cloudflare Pages deployment detail that matters
In our setup, GitHub Actions and Cloudflare Pages were each connected to the repository independently. GitHub Actions reported whether its checks passed, and Cloudflare Pages responded to Git changes and built the site itself, so a failed GitHub Actions run did not automatically stop Cloudflare from attempting a deployment.
Cloudflare did run its own production build, including the postbuild scripts, and if an enforced script failed, that build failed. So there were two different safeguards: validation reported by GitHub Actions, and validation performed inside the hosting platform's build.
For this project we also had a written review and release procedure, local pre-push validation and a rule against ordinary direct pushes to main. The local hook was useful discipline, but it is not server-side branch protection, because it can be bypassed or missing on another machine.
If a project needs a hard release gate, I would prefer enforceable branch rules, required status checks, or a deployment workflow that explicitly depends on successful validation. Do not assume a green CI check controls production until you have confirmed how deployment is actually connected. Cloudflare documents the Git integration(opens in a new tab) that automatically deploys on a push.
Postbuild checks: why we added 13 scripts
Type checking and linting do not validate everything a production website needs, so the project ran 13 scripts in its postbuild sequence. Each one reads the built HTML and assets and fails the build on a mistake. One applied per-page Content Security Policy configuration, and the others checked properties of the generated output.
These checks read the built output because browsers and search engines deal with the generated pages, not with the TypeScript source. A generated page can compile and still contain any of the problems below, and we wanted those caught before deployment.
- A broken internal link.
- More than one H1.
- A wrong canonical URL.
- Missing image alt text.
- Structured data that contradicts the page.
- Analytics behavior that breaks the site's consent rules.
- Assets that exceed their weight budgets.
| Area | Examples of checks |
|---|---|
| Page structure | H1 count, heading order, alt text, duplicate IDs |
| Links and content relationships | Internal links, article relationships, expected listings |
| Search and social metadata | Canonicals, robots rules, JSON-LD, Open Graph, sitemap |
| Security and consent | CSP configuration, approved resource hosts, analytics behavior |
| Performance budgets | HTML, JavaScript, CSS and image sizes |
| Build integrity | Expected generated files and output consistency |
Keeping postbuild quality gates useful
Two rules kept the gates honest. When a gate found a real problem, we fixed the content or implementation instead of lowering the gate to get a passing build. When a new content structure needed validation, we updated the checks in the same change. Those rules kept the scripts from turning into a pile of exceptions nobody understood.
Some warnings are better than hard failures, as long as the decision is deliberate. I would not copy all 13 scripts into every project. A small application with other requirements may need fewer checks, or different ones. Validate the failure modes that matter for what you are building.
GitHub Actions billing minutes: the October usage report
October's GitHub Actions usage review drove the first big decision. Across the month the repository had used 1,172 billed minutes. Accessibility and Lighthouse audits accounted for 916 of them, about 78%, and the rest went to validation, Dependabot and post-deploy jobs that did nothing useful.
| Job category | Billed minutes and share |
|---|---|
| Accessibility and Lighthouse audits | 916 minutes, about 78% |
| Validation and Dependabot | 148 minutes, about 13% |
| Post-deploy jobs with no useful work | 108 minutes, about 9% |
| Total | 1,172 minutes, 100% |
Which triggers ran the audits
Audits used most of the time, so we looked at what triggered them. Pushes to main used 420 audit minutes, pushes to staging used 312, and pull requests used 184. Some commits were pushed to both main and staging, so expensive checks ran again on changes that had already been validated.
Workflow design, not any single slow step, drove the cost. That is why I prefer to review usage by job and event before optimizing individual commands. A job can be efficient on its own and still be expensive because it runs unnecessarily.
| Trigger | Audit minutes |
|---|---|
| Pushes to main | 420 |
| Pushes to staging | 312 |
| Pull requests | 184 |
| Total | 916 |
Lighthouse CI template sampling: from 159 runs to 18 pages
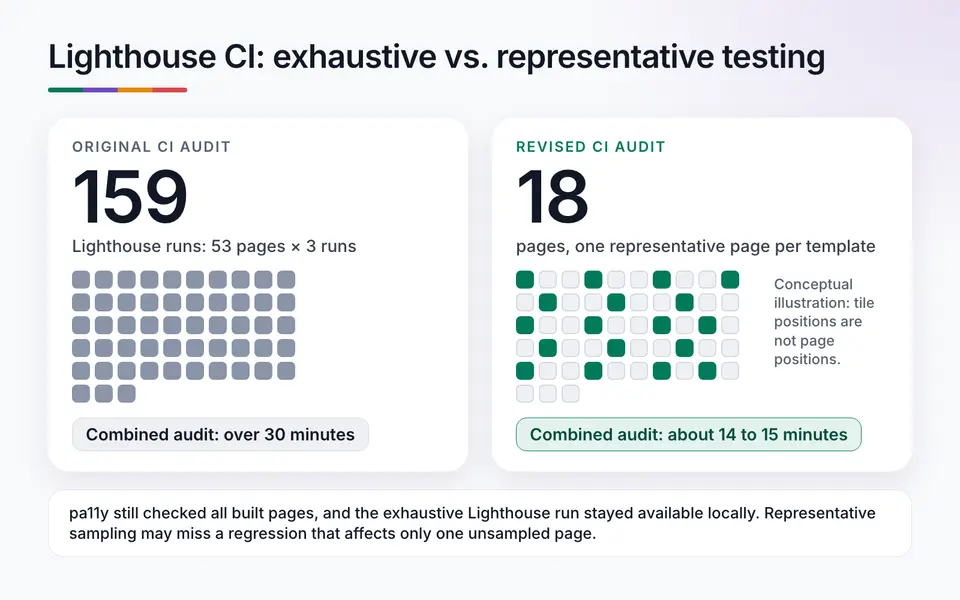
Originally, Lighthouse ran three times on each of the 53 built pages, which is 159 executions. One run took about 12 seconds on the shared runner, and the combined accessibility and performance audit took more than 30 minutes. Our aim was to keep meaningful coverage without repeating expensive checks on pages that share a layout.
Eighteen representative pages covered the site's templates. Many template-level problems show up on a representative page even if every page is not audited by Lighthouse in CI. That cut the combined audit to about 14 to 15 minutes. Lighthouse CI itself runs three times per URL by default, and its web.dev guide(opens in a new tab) covers the setup.
This did not reduce every check to 18 pages. pa11y still ran across the full set of built pages, including the 404 page, and the exhaustive Lighthouse audit stayed available locally.
Why single-run performance metrics became warnings
Lighthouse timing varies between runs, especially on shared runners. One run is enough to reveal an obvious problem, but it is a poor basis for blocking every pull request. In single-run mode, LCP and CLS were warnings, while accessibility and best-practices thresholds still failed the audit.
That was a trade-off between feedback speed and confidence in the measurement. Lighthouse's own variability guide(opens in a new tab) lists the sources of run-to-run spread, from network conditions to client hardware. Sampling has its own limit: a Lighthouse issue on a single unsampled page could be missed. Accepting that, we kept the broader accessibility checks and the local full audit. Claiming unchanged testing was never the aim; placing each check where its feedback is worth its cost was.
| Audit mode | Lighthouse approach |
|---|---|
| Pull request | One run per sampled page |
| Nightly audit | Three runs per sampled page |
| Manual audit | Three runs per sampled page |
| Local exhaustive audit | Full page set when requested |
The 108 minutes spent on jobs that did nothing
Two post-deploy jobs were set to run after a successful hosting build, one to purge a cache and one to submit search-engine updates through IndexNow. Before launch, neither had any work to do, but the workflows still started both jobs, checked for the missing production configuration, printed a skip notice and exited.
October's report showed 54 cache-purge runs using 54 billed minutes and 54 IndexNow runs using another 54. That is 108 minutes for work that was not needed yet.
Gating those jobs on a repository variable for the production configuration stopped them from being created before it existed. No full billing period has passed since that change, so we cannot state what it saved.
Artifact storage needed attention too
A typical Lighthouse report upload was about 46 MB. Repeated uploads, combined with frequent audit runs and each commit running twice, contributed to the storage alert. Under the new artifact policy, Lighthouse JSON reports upload only when an audit fails, with a one-day retention period.
HTML reports were dropped from the automatic upload and older artifacts were cleaned up. Progress notes recorded 48 artifacts removed, about 2.17 GB. Artifact size, upload conditions and retention can add cost even when the underlying test is worth running, so look at the whole workflow and not only job duration.
An npm lockfile that worked locally and failed on Cloudflare Pages
Our first Cloudflare Pages build failed during npm ci with the error shown below, although it built fine on the development machine. Locally, npm 11 had generated the lockfile, while the remote environment used npm 10. Regenerating package-lock.json with npm 10 added 14 lockfile entries and changed no dependency versions.
Reproducible builds depend on more than matching Node.js versions. Package manager version matters too. When an install fails, I now check the runtime, package manager version, lockfile and clean-install behavior before suspecting the application code.
Missing: proxy-agentA temporary review widget that failed the accessibility audit
pa11y began reporting an untitled iframe across the site, and Lighthouse best-practices scores fell from 1.00 to 0.79. A temporary third-party feedback widget used during review caused it, injecting a hidden iframe and bringing in other third-party behavior.
Narrowly scoped audit exclusions covered the widget, each documented with a reason, and the broader thresholds stayed where they were. That was appropriate because the widget was a review overlay and not part of the published site. If it had been a permanent part of the user experience, excluding it from accessibility evaluation would have been a different decision.
A GitHub Actions concurrency group that let a push cancel the nightly audit
After moving the expensive checks to a nightly schedule, we found that a push to main could cancel an audit already running. Our concurrency group used only the Git ref, which a scheduled audit and a push to main shared in our setup. Adding the event name to the group fixed it.
Now a new push can cancel an outdated push run without interrupting the scheduled audit. This shows how a setting can look sensible until you list every event that can share its key. GitHub's concurrency documentation(opens in a new tab) shows how a group name decides which runs cancel each other.
concurrency:
group: ${{ github.workflow }}-${{ github.ref }}-${{ github.event_name }}
cancel-in-progress: trueWhere each CI/CD check should run
Placement was the most useful outcome. Instead of asking how many checks we could add, we asked where each one gives the most useful feedback, from the local commit to verification of the live site.
Live-site verification matters because our protected previews could redirect an unauthenticated request to a login page. An automated test that receives that redirect is not testing your application. Build-based audits ran against a local preview of the generated output, and live-environment checks stayed separate.
- Local pre-commit: type checking, linting and formatting. Quick, and usually fixable at once.
- Local pre-push: full validation before a commit leaves the machine. The hook skipped the rerun for a commit SHA that had already passed.
- GitHub Actions: clean-environment validation on pull requests and pushes to main.
- Pull request and scheduled audits: the costlier accessibility and Lighthouse checks, with sampling and repetition set per trigger.
- Cloudflare Pages: the hosting platform's own production build, including the postbuild checks.
- Live-site verification: redirects, edge headers, crawler access and anything else that depends on the deployed environment.
Security and release controls still matter
Reducing CI minutes should not weaken release safety, so the optimization kept the project access, timeout and rollback controls in place. What stayed is listed below, and the paragraphs after it explain the one deliberate trade-off we made on action pinning.
Major version tags cover first-party actions, and Dependabot keeps them current. Pinning every action to a full commit SHA is the stricter option, and we chose the lower-effort one for a low-risk static site. A project with a higher risk profile should weigh that differently.
Static deployment also reduced the application secrets present in the build output. That suited this architecture, but it is not a reason to assume every application can do the same. An API service, a containerized application or a system with database migrations needs other release controls and integration tests. Architecture should follow the real operational risks.
- Read-only permissions for routine GitHub Actions validation.
- Explicit job timeouts.
- Controlled handling of repository secrets.
- Protected preview environments.
- Deliberate production release procedures.
- Documented rollback options.
- No assumption that a local Git hook is authoritative branch protection.
A practical CI/CD optimization checklist
If you are reviewing a pipeline, start with what triggers each workflow and how often it runs, then check what actually blocks production. Checks below follow that order, and each one maps to a problem described earlier in this article.
Measure the existing behavior before you change anything. Without a baseline, it is hard to tell a real improvement from a configuration that simply runs fewer checks.
- Map every workflow trigger: pushes, pull requests, schedules, manual runs and deployment events.
- Find jobs that run more than once for the same effective change.
- Review the slowest jobs and how often they run.
- Check whether any job starts only to discover it has nothing to do.
- Confirm that local, CI and hosting environments use compatible runtimes and package managers.
- Separate fast validation from expensive or noisy audits.
- Decide whether template sampling suits your repeated tests.
- Check what the production build validates beyond source-level correctness.
- Review artifact sizes, upload conditions and retention.
- Verify that concurrency groups cancel only the intended work.
- Confirm what actually blocks production deployment.
- Document how to test and roll back workflow changes.
What improved, and what we have not measured
Several obvious inefficiencies were addressed. Fast validation stayed around the two-minute mark, and the combined accessibility and Lighthouse audit took about 14 to 15 minutes after sampling, against more than 30 minutes before. Duplicate staging CI runs were removed, expensive audit triggers changed, artifact uploads reduced and pre-launch post-deploy jobs stopped from starting.
Two limits apply. First, the 1,172-minute figure is a baseline from the project's first two weeks, in October. A complete billing period after the changes was not available when these notes were prepared, so I am not claiming a measured monthly cost reduction. Second, the revised workflow does not run every audit with the same scope and frequency as before. Sampling and warning policies were deliberate compromises.
Final thoughts: find out what is already running
A pipeline can have good tests, a green status and automatic deployments and still have unnecessary execution or unclear release controls. Adding checks to protect the website came first, then examining the checks themselves: what each one protects, how often it runs, what it costs, and whether its failure affects deployment.
Nothing here added a complicated new architecture. What we gained was a clearer picture of the one we already had, followed by targeted changes. Before adding another check or rewriting a workflow, find out what is already running and why.
A free CI/CD pipeline review kit
This kit packages a GitHub Actions starter workflow and a read-only AI audit prompt based on these lessons. Use it to review workflow triggers, duplicate execution, dependency consistency, quality gates, permissions, artifacts and deployment safeguards. Its prompt runs in a read-only mode and tells the agent not to modify files or trigger workflows.
Treat it as a starting point for analysis, not a guarantee that every suggested change suits your application. Read its assumptions and limitations, and test anything before you rely on it. You can get the CI/CD Pipeline Review Kit(opens in a new tab) from its release page. Our other free templates, prompts and checklists are in the free-tools repository(opens in a new tab).
References and measurement notes
Project measurements in this article come from anonymized repository records, progress notes and an October 2026 GitHub Actions usage report documented on 1 November 2026. Configurations shown are simplified teaching examples, not a copy of the project repository.
Vendor documents named in this article were opened on 8 November 2026. Confirm current behavior and limits before you adapt anything. Every number comes from the project's own records, and none is a market benchmark.
Questions about CI/CD pipeline optimization for Astro
Does a failed GitHub Actions check stop a Cloudflare Pages deploy?
Not in our setup. GitHub Actions and Cloudflare Pages were each connected to the repository separately, so a failed Actions run did not stop Cloudflare from building. Cloudflare's own build did fail when an enforced postbuild script failed. For a hard gate, use branch rules with required status checks, or a deployment workflow that depends on validation.
How do I reduce GitHub Actions minutes?
Review usage by job and trigger before tuning commands. Our October audits ran on every push to two branches. Moving them to pull requests, a nightly run and manual runs, sampling Lighthouse by template, and stopping jobs that only printed a skip notice addressed the main causes. We have not yet measured the monthly saving.
How many pages should Lighthouse CI test?
It depends on how many templates the site has. We tested 18 representative pages out of 53, one per template, and kept pa11y on every built page. Sampling can miss a problem on one unsampled page, so keep a full local audit available.